Login to Customer Portal
 Contact
 Search
The Best Business Intelligence Reporting Tools for Manufacturing Commercial Intelligence
Compare leading business intelligence reporting tools for manufacturing and learn where BI, CRM, ERP, and CPQ-native analytics fit for commercial intelligence.



If you’re comparing business intelligence tools for manufacturing, the tool you pick determines what questions you can actually answer. General BI platforms give you enterprise-wide visualization, CRM reporting gives you pipeline visibility, and ERP systems give you operational and financial reporting. Alongside these, native analytics, such as Tacton Insights & Analytics in CPQ, understands the configuration context behind your quotes, so you can see not just what your BI tool tells you is winning, but why.
Explore the main types of analytics tools used in manufacturing, their strengths and limitations for commercial decision-making, and what to look for when evaluating them.
What is commercial intelligence in manufacturing and why does the analytics tool choice matter?
Commercial intelligence in manufacturing is the understanding of sales performance, both at a high level (e.g., revenue, pipeline, win rates, etc.) and a deeper level about the drivers behind performance (e.g., why certain deals closed faster, which deals produce the best margin, etc.).
Commercial intelligence is also the ability for sales, product, and operations teams to independently answer questions about things like win rates, margin drivers, portfolio demand, and forecasting, from data already generated in the sales and quoting process.
Manufacturing is a distinct use case as product complexity and highly customized solutions creates challenges in understanding performance at the variant level for custom and configurable engineered products. That’s why the type of business intelligence reporting tools matter. While some reporting tools are built for general enterprise use, others are best for answering questions more specifically.
Types of business intelligence reporting tools used in manufacturing
Manufacturers typically rely on one or more of these four categories of reporting tools for commercial and operational intelligence.
General BI platforms (Tableau, Power BI, Looker)
General BI platforms are used for enterprise data visualization. These platforms connect to multiple data sources, taking raw data, often through APIs and re-contextualizing it through dashboards.
Best for:
- Cross-functional trend analysis
- Financial reporting
- Executive dashboards
- Data consolidation across systems
Pros:
- Highly flexible
- Powerful visualization
- Connects to almost any data source
- Strong IT governance
Cons:
- Requires data modeling and dashboard maintenance by technical teams
- No native understanding of your product or configuration logic
- Insights lag behind commercial activity depending on how often data is pulled
- High dependency on IT for non-technical users
The best fit for general BI platforms in manufacturing is enterprise-wide performance reporting and financial roll-ups.
CRM reporting (Salesforce and similar)
Customer relationship management (CRM) tools offer reporting on sales pipelines and opportunity tracking with built-in reporting on deals, activities, and revenue.
Best for:
- Pipeline visibility
- Sales activity tracking
- Revenue forecasting at the deal level
Pros:
- Native to the sales workflow
- Good for rep-level performance and pipeline management
Cons:
- Tracks opportunities and outcomes, but not the configuration decisions behind what sold and why
The best fit for CRM reporting in manufacturing is sales activity management and pipeline reporting, not product or portfolio performance and how that impacts commercial outcomes.
ERP reporting (SAP, Oracle and similar)
This type of reporting provides manufacturers with operational reporting built into enterprise resource planning (ERP) systems, covering production, inventory, financials, and order fulfillment.
Best for:
- Operational performance
- Supply chain visibility
- Financial compliance reporting
Pros:
- An authoritative source for what was ordered and produced
- Strong financial controls
Cons:
- ERP reporting shows outcomes after the fact (i.e., what was sold and shipped), rather than the decisions that got you there
The best fit for ERP reporting in manufacturing is operational and financial reporting post-order over pre-sale commercial intelligence.
What is CPQ-native analytics?
CPQ-native analytics is analytics embedded directly inside Configure, Price, Quote (CPQ) systems that contextualize the configuration and quoting data already captured in the sales process. It shows both what was quoted and converted into an order and what is explored but does not convert.
Best for: Configuration-level commercial intelligence (e.g., win rate by product and variant, margin analysis, quote velocity, portfolio performance, and demand signals from quote activity)
Pros:
- No data prep or IT dependency, because insights are available in the commercial workflow
- Pre-modeled for manufacturing commercial questions and use cases
- Captures the full context of the deal from customer requirement through to pricing decision
- Reveals buying intent, early demand signals, and product combinations customers explored that doesn’t show in historical order reports
- Understanding the why helps recreate profitable deals or portfolio decisions
Cons:
- Scope is specific to CPQ data, so it’s not a replacement for enterprise-wide BI tools
The best fit for CPQ-native analytics in manufacturing is commercial intelligence for sales, product, and operations teams who need answers about how the behavior and choices made during sales configuration impact outcomes (e.g., which configurations perform best for a particular application or region, which configurations create margin erosion, which configurations lead to longer sales cycles, and more).
The commercial reporting gap none of these tools solve alone
Each business intelligence reporting tool covers a slice. BI has breadth but not product context; CRM has pipeline but not configuration detail; ERP has outcomes but not the decisions that drove them.
Commercial intelligence in manufacturing the full picture of why products win, where margin erodes, and what quote activity signals about future demand lives in the quoting and configuration process
Manufacturers already generate this data every time a product is configured and quoted.
According to the Tacton 2026 State of Manufacturing Report, fewer than half of manufacturers currently report at the configuration level. Commercial teams rely on manual exports, Excel analysis, or wait weeks for BI reports to answer questions that should take minutes It’s an untapped layer of analytics that gives greater context to configuration decisions.
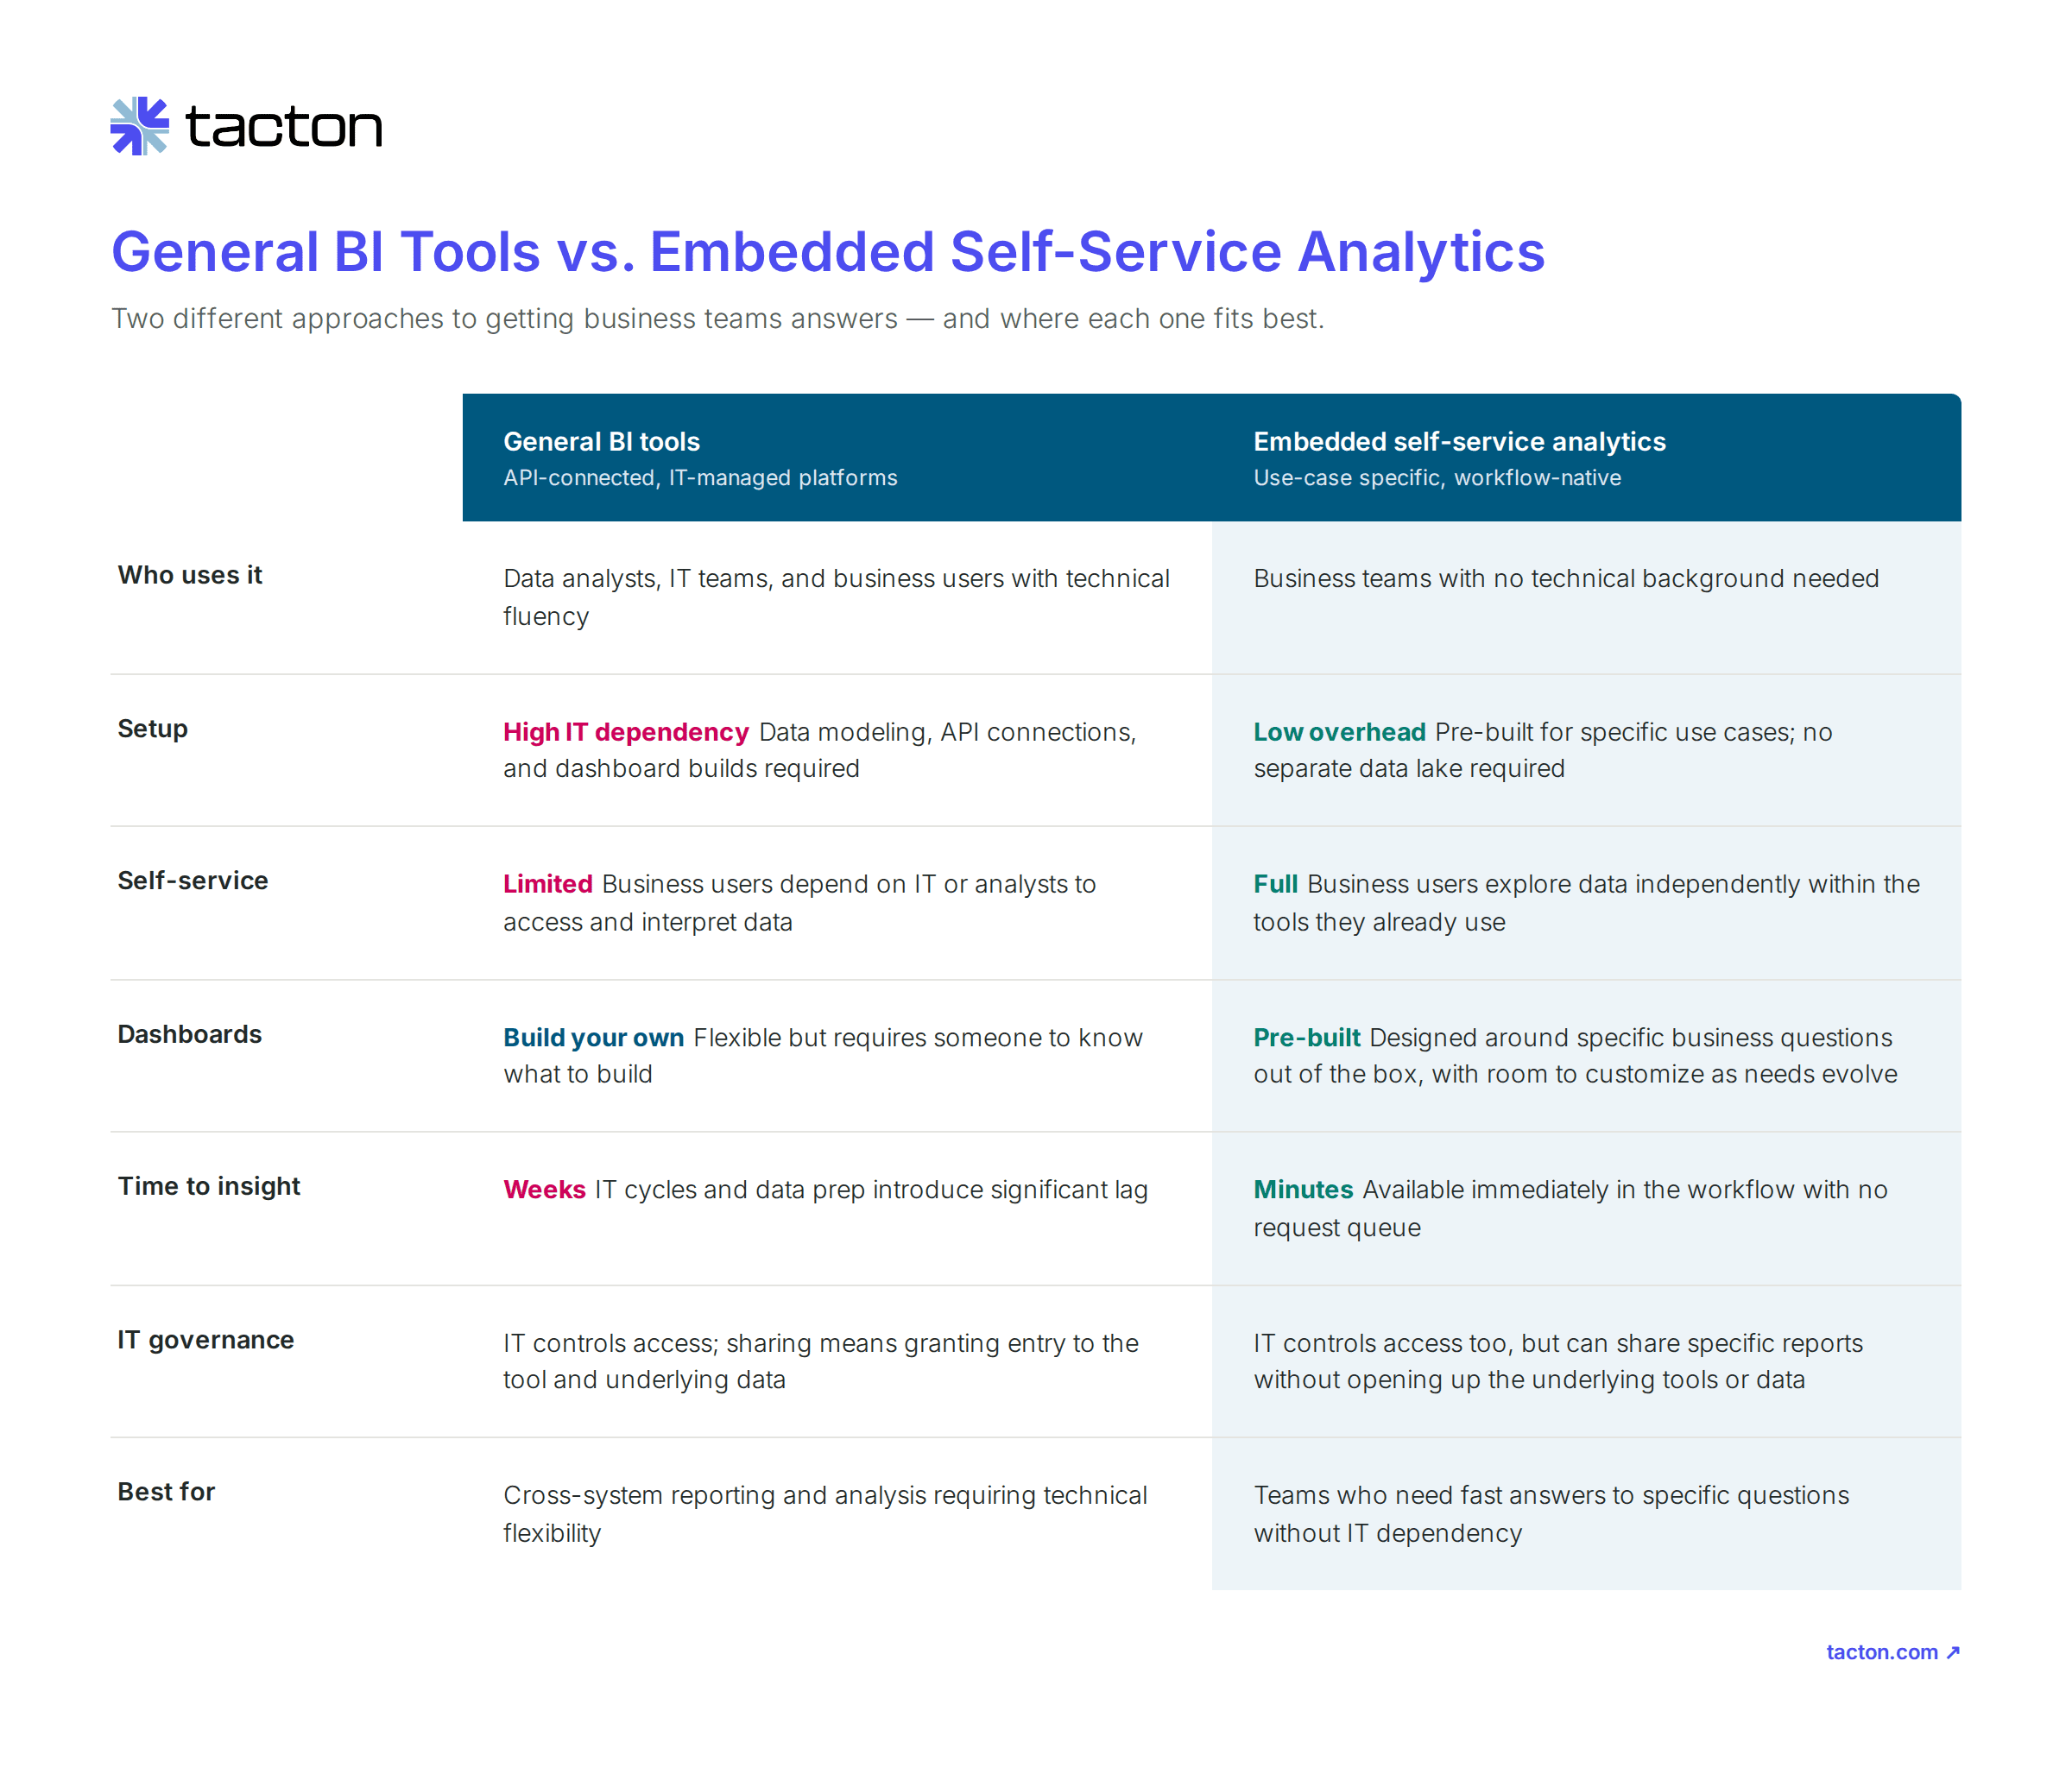
General BI reporting tools versus self-service commercial analytics
The limitations of today’s traditional reporting tools drive a shift toward analytics tools built specifically for manufacturing commercial use cases, embedded in the systems teams already use and pre-modeled for the questions they ask.
Self-service analytics offers pre-modeled, often customizable dashboards that all stakeholders can access without IT requests, separate logins, or the need to contextualize and model data on their own. Insights are available directly in the quoting and commercial workflow and shareable across the organization.
The best business intelligence and commercial analytics tools for manufacturers
The right tool depends on the commercial question you’re trying to answer. Here are the leading options across categories, and what each does best for manufacturing teams.
1. Tacton Portfolio Performance Intelligence
Category: CPQ-native analytics
Portfolio Performance Intelligence, part of the Tacton Insights & Analytics suite, is configuration-aware commercial analytics embedded directly in Tacton CPQ.
Best for: Manufacturers with complex, configurable products who need visibility into win rate, margin performance, portfolio demand, and quote velocity.
Key capabilities:
- Win rate by configuration and variant
- Margin analysis at the product and option level
- Quote velocity and deal friction
- Portfolio usage (which variants are rarely configured vs. high-performing)
- Early demand signals from quote activity
- Role-based dashboards for sales, product, and operations
Who it’s for:
- Sales leaders
- Product managers
- Operations and forecasting teams
Tacton’s analytics tool is the only tool that understands the configuration context behind commercial outcomes, built for manufacturers where product complexity is the norm. The tool works from your existing configuration logic, pricing logic, and decisions within CPQ.
Works alongside: existing BI platforms, CRM, ERP, and more.
2. Tableau
Category: General BI platform
Best for: Enterprise-wide data visualization and cross-functional reporting
How it works: Tableau connects to multiple data sources via API and native connectors, allowing teams to build custom dashboards and visualizations across any dataset.
Strengths:
- Highly flexible, strong visualization capabilities
- Large ecosystem of integrations
- Good for presenting data to executive and cross-functional audiences
Limitations:
- Requires data modeling and dashboard maintenance by technical teams
- Non-technical users depend on IT or analysts to access insights
- No pre-built manufacturing commercial templates
- Insights lag behind commercial activity
Ideal customer profile: Large enterprises with dedicated BI or data teams who need flexible, cross-system reporting at scale
3. Microsoft Power BI
Category: General BI platform
Best for: Organizations already in the Microsoft ecosystem looking for connected reporting across Dynamics, Azure, and Teams
How it works: The platform pulls data from Microsoft and third-party sources via connectors and APIs; business users can build reports within the Microsoft environment they already work in.
Strengths:
- Strong integration with Microsoft products
- Relatively accessible for non-technical users compared to other BI platforms
- Cost-effective for Microsoft-licensed organizations
Limitations:
- Best value only for organizations already on Microsoft stack
- Custom manufacturing commercial analysis still requires IT involvement
- No native understanding of product or configuration data
Ideal customer profile: Mid-to-large manufacturers running Dynamics CRM or Azure who want reporting consolidated within their Microsoft environment.
4. Looker (Google Cloud)
Category: General BI platform
Best for: Data teams that need a governed, code-first analytics layer across cloud data sources
How it works: Looker uses a proprietary modeling language (LookML) to define data relationships centrally, then surfaces those models to business users through a browser-based interface.
Strengths:
- Strong data governance
- Consistent metrics definitions across the organization
- Good for teams that want a single source of truth across complex cloud data environments
Limitations:
- High technical barrier to setup and maintenance
- LookML requires dedicated data engineering resources
- Not designed for operational or workflow-embedded use cases
Ideal customer profile: Data-mature organizations with engineering resources who need governed, scalable analytics across large cloud datasets.
5. Salesforce Reports and Dashboards
Category: CRM reporting
Best for: Sales pipeline visibility and rep-level performance tracking within the Salesforce ecosystem
How it works: Salesforce surfaces deal, activity, and revenue data already captured in Salesforce CRM; standard reports are available out of the box with drag-and-drop customization for sales ops teams.
Strengths:
- Native to the sales workflow
- Accessible to non-technical sales ops users
- Good for pipeline management and forecasting at the opportunity level
Limitations:
- Tracks deal outcomes and sales activity, not what was quoted or configured
- Limited product-level or portfolio intelligence
- Insights are bounded by what Salesforce captures
Ideal customer profile: Sales-led organizations that want pipeline and rep performance reporting within their CRM without additional tooling.
6. SAP Analytics Cloud
Category: ERP-integrated BI
Best for: Manufacturers on SAP who need financial, operational, and supply chain reporting in a single environment
How it works: SAP Analytics Cloud connects directly to SAP ERP and S/4HANA data, surfacing operational and financial performance through pre-built and custom dashboards within the SAP ecosystem.
Strengths:
- Deep integration with SAP data
- Strong for financial consolidation and compliance reporting
- Familiar environment for SAP-heavy organizations
Limitations:
- Strong post-order
- Limited visibility into pre-sale commercial activity
- Not designed for quoting, portfolio, or configuration performance analysis
- Value is heavily dependent on existing SAP investment
Ideal customer profile: Large manufacturers already running SAP who want analytics consolidated within their existing ERP environment.
Make data-driven commercial decisions with the right tool for complex manufacturing
Get commercial intelligence to the teams who need it. Tacton Portfolio Performance Intelligence is built specifically for configuration-level commercial analytics that the entire organization, from sales to supply chain, can use to improve win rates, portfolio management, profitability, forecasting, and more.